Cutting through the ETS-Washing – How Europe licensed away its chemical industry

The UK and EU have laid the groundwork for linking their emissions trading schemes (ETS). On paper, it looks like an administrative optimisation. Yet a cautionary statement is needed based on EU ETS impacts to date.
Carbon polluters face multiple liabilities from a timeline of emissions that stretches past, present, and future—liabilities that companies routinely acknowledge in their own disclosures. In this edition of EnabledFuture‘s Circularity newsletter, we look at the historical impacts of the EU Emissions Trading System (ETS) and its unintended consequences.
We start with a contrasting example: the UNFCCC Clean Development Mechanism (CDM). We examine how it achieved tangible greenhouse gas (GHG) reductions through genuine technology development and deployment.
We then turn to the EU Emissions Trading Scheme (EU ETS)—and scrutinise a widely cited July 2026 study from the LSE Grantham Institute—before uncovering a broader truth about carbon intensity reductions in the petrochemical and heavy industrial sectors: they were driven by global strategic forces long before Europe’s carbon market took hold. With that in mind, we question the wisdom of doubling down on the scheme.
The UNFCCC Clean Development Mechanism: Rewarding Real Innovation
Before the EU ETS matured, the United Nations Framework Convention on Climate Change (UNFCCC) operated its own project-based carbon market: the Clean Development Mechanism (CDM). Because the CDM rewarded projects based on Global Warming Potential (GWP), the most potent greenhouse gases became the most economically attractive targets to abate.
Nitrous oxide (N₂O), for example, carries a GWP roughly 280 to 310 times greater than carbon dioxide (CO₂). Applying a factor of 265, the CDM turned every metric tonne of N₂O abated into lucrative business. That incentive directly funded the development and commercial retrofit of catalytic N₂O abatement catalyst. The basic flowsheet below is indicative of the process configuration for a N2O abatement project for MICCO in Vietnam.
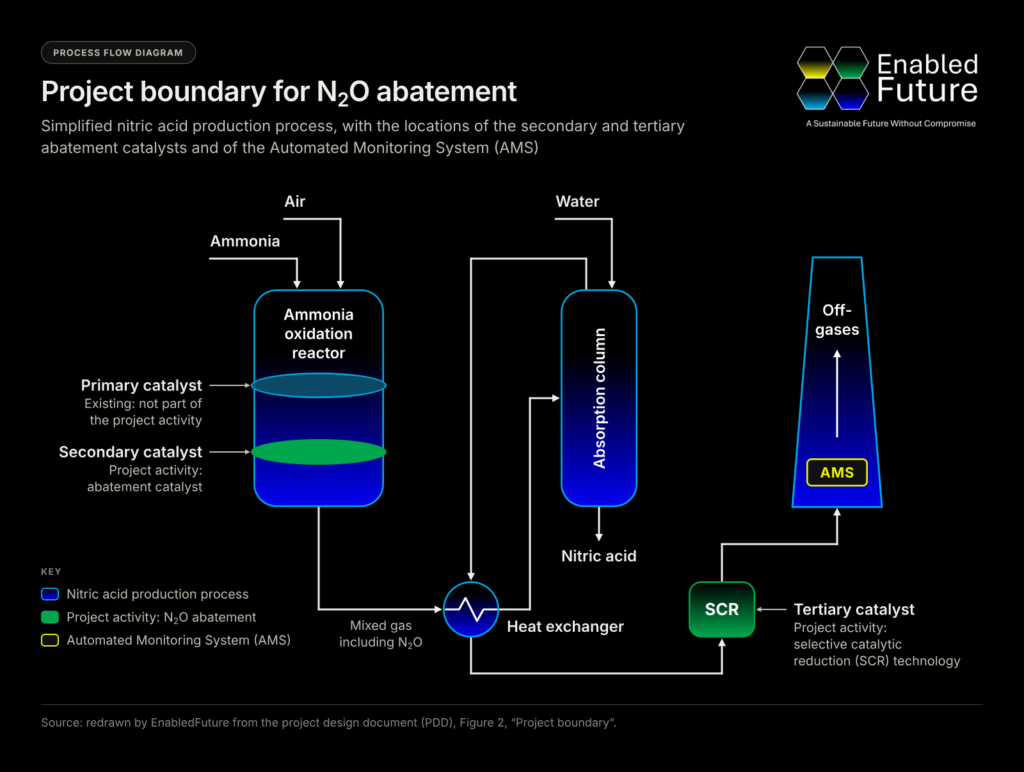
Johnson Matthey (on the catalyst side) and Yara International (on the nitric acid and fertiliser production side) partnered under the scheme, retrofitting Matthey’s nitrous oxide abatement catalyst into existing nitric acid plants as well as new builds.
Between 2006 and 2013, the Certified Emission Reductions (CERs) issued and traded for cash generated meaningful profits for the project partners even after capital costs and taxes. When credits were withdrawn after seven years under scheme rules, the technology’s unit economics meant it could survive without subsidies.
That is precisely how a carbon policy ought to behave: companies partnered to develop, commercialise, and deploy real abatement hardware—and profited directly from every tonne their engineering removed.
A retrospective review of the CDM for 2005–2020, published in PLOS Climate in 2022, reported 2.043 Gt CO₂eq of reductions against 2.444 Gt forecast, across the 3,311 projects and monitoring periods analysed. While the authors highlight a 16.4% shortfall against the projects’ forecasts, we regard achieving approximately 84% of forecast reductions as a substantial achievement for a global scheme that was the first of its kind. The study also found that N₂O projects exceeded their aggregate emission-reduction targets.
The authors’ concerns about the later participation of least developed countries, and the lower credit prices they encountered compared with early beneficiaries such as China, India, South Korea and Brazil, are valid and should inform future policy.
The authors estimated CER revenues of €10.480bn and €0.173bn for the first and second Kyoto commitment periods respectively: €10.653bn in constant 2010 euros. Dividing that total by the reported 2.043 Gt CO₂eq gives approximately €5.21 in estimated carbon-credit revenue per reported tonne abated. This is our calculation from the authors’ figures, rather than a measure of the scheme’s total cost.
The revenue analysis includes credit issuances through 30 August 2021 and deducts the 2% Adaptation Fund contribution.
The EU ETS and the Flawed LSE Grantham Institute Analysis
Launched in January 2005, the EU ETS was established as the world’s first major international “cap-and-trade” carbon market. Operating across power plants and energy-intensive industries, it sets a declining cap on total allowable emissions and requires facilities to surrender tradable allowances for every tonne of CO₂eq emitted.
Notably, it was the EU ETS itself—acting as the world’s largest compliance buyer of CDM credits between 2008 and 2012—that gave those CERs their market value, before Brussels restricted industrial gas offsets in 2013 and phased out international credits altogether.
After a turbulent pilot phase marked by over-allocation and collapsing permit prices, Brussels progressively tightened the cap, shifted from free allowances to auctions, and expanded coverage to aviation, maritime transport, and non-CO₂ gases. Today, the EU ETS remains the cornerstone of European climate policy.
A July 2026 working paper (Authors – Bogachev and Venmans) published by the LSE Grantham Institute assessed the causal impact of the EU ETS between 2008 and 2023. Its headline claim is eye-catching: while industrial emissions fell by 12% in Phase 2 (2008–2012) and 18% in Phase 3 (2013–2020), they supposedly plunged by 41% in Phase 4 (2021–2023)—translating, by the authors’ math, into 4.04 billion tonnes of avoided emissions and €400 billion in avoided climate damages.
Anyone familiar with the multi-decade capital cycles required to decarbonise petrochemical and heavy industrial assets by 40–60% will find it hard to believe that European industry achieved a 41% structural reduction in just three years. A closer look at the LSE paper’s own data reveals why that headline number does not hold up to scrutiny:
1. A tiny, skewed sample of mid-sized plants—not Europe’s industrial base. The study does not measure Europe’s major power stations, integrated steelworks, or mega-refineries. Because its matching methodology pairs ETS plants with unregulated non-ETS plants of similar size, massive installations without small non-ETS peers are excluded across all four countries studied. Out of more than 10,000 installations covered by the EU ETS across Europe, the study tracks just 1,101 mid-sized ETS facilities across France, the UK, the Netherlands, and Norway.
2. It measures absolute emissions against a hypothetical baseline—not carbon intensity. Crucially, the 41% figure is not a measured 41% improvement in plant carbon intensity achieved within three years. It is a modelled reduction relative to an econometric counterfactual comparing ETS plants against unregulated peers over nearly two decades. Because the underlying registry data tracks only total tonnes of CO₂—with no data on factory output or production volumes—the paper cannot separate genuine technological improvement from simple output curtailment. When a chemical plant or furnace scales back production, the model records a climate triumph.
3. The “41% Phase 4 miracle” is largely the 2022 energy crisis in disguise. Look at the paper’s year-by-year breakdown: the Phase 4 average is dragged down by a sudden plunge in 2022, right as Russian gas supplies collapsed and European energy prices spiked. Factories did not suddenly invent and install breakthrough clean technology in 2022; energy-intensive plants across the Netherlands and France curtailed output and shut down lines in response to historic natural gas and power costs. Even mathematically, the 95% confidence interval implied by the paper’s own standard errors for its 4.04-billion-tonne claim spans anywhere from 1.4 billion to 7.3 billion tonnes—a margin of error wider than the entire estimated impact of the scheme’s first decade.
4. Volume-weighting lets a handful of Dutch and French outliers skew the total. When the authors weight every factory in their sample equally (via standard OLS regression), the overall 2008–2023 reduction drops from 20% to just 12%. To get their larger headline numbers, they use a volume-weighted model (PPML) where a small number of larger plants dominate. In fact, removing just 113 Dutch installations from the sample cuts the overall baseline effect nearly in half and renders it statistically insignificant. Meanwhile, in the UK—which accounts for nearly half of all plants in the dataset—the volume-weighted ETS effect is statistically indistinguishable from zero (+3%).
5. Extrapolating mid-sized manufacturing onto the entire European economy Finally, the authors take that noisy 41% Phase 4 figure—measured on 1,101 mostly mid-sized plants (including post-Brexit UK facilities that were no longer even in the EU ETS after 2020)—and apply it across every power plant, airline, and steel mill in Europe to claim 800 million tonnes of avoided emissions per year.
The Deeper Truth: Structural Shifts Preceded the ETS
Even where genuine carbon intensity reductions have occurred across the petrochemical and chemical sectors, attributing them to the EU ETS mistakes correlation for causation.
Long before Phase 4 carbon prices spiked, global petrochemical operators were already driving down energy and carbon intensity per tonne of output. Why? Because energy and hydrocarbon feedstocks represent the single largest variable cost in chemical manufacturing, and competition from low-cost gas and feedstock hubs in North America and the Middle East forced European assets to optimize heat integration, upgrade crackers, and rationalize inefficient capacity simply to stay globally solvent. Those strategic capital investments had their sights set on global competitiveness from the outset—not Brussels’ permit auctions.
There was an even more consequential strategy that was playing out. The carbon intensity reductions that European chemical producers and process licensors were striving to achieve had a completely different end-game in mind.
Energy efficiency and other chemical engineering improvements were increasing single-train unit sizes. On paper they looked like ETS-driven carbon intensity reductions. The commercial benefits were much more consequential, and they were not part of European regional strategy:
- The Volume Threshold: A multi-million-tonne complex could guarantee multi-year, uninterrupted offtake contracts for massive volumes of polyethylene, polypropylene, or monoethylene glycol from a single integrated site.
- Market Share Grab: Once a mega-complex signed long-term offtake agreements with tier-one downstream buyers, that slice of accessible market share was effectively closed off to other global producers for a decade or more.
- Locking Out Legacy Plants: Smaller, fragmented crackers and polymer lines simply could not underwrite those single-contract volumes or offer the same supply redundancy. Many Chinese and other regional aged assets, Europe included, were forced to close.
This dynamic turned petrochemical complex builds into a race for capacity dominance that continues on today. That was an industry strategy, not an accident. Europe cannot be blamed for having more worthy aims than weaponisation of energy efficiency. Likewise indigenous Chinese companies and technology producers cannot be blamed for maximising their structural energy and feedstock advantages. Especially not given the participation of their own supply chain in the huge glut of plan builds that began from the beginning of the 21st century. Western EPC, licensing, commissioning and ongoing technical support for non-European plants realised incredible profits for companies with European bases.
As a point of evidence – when Johnson Matthey acquired Davy Process Technologies in 2006, — that business generated substantially higher operating margins (return on sales) than automotive catalysts and drove disproportionate incremental profit growth. During the 2008–2009 global automotive collapse and the 2012–2013 European car slump, DPT’s licensing and commissioning fees in China kept Process Technologies expanding while automotive catalyst profits stagnated or fell. Likewise, in the period 2020-2025, Clariant’s EBITDA moved from the mid-teens to peak at 20.6% in 2025, boosted by global olefin capacity licensing projects.

Across the twenty-year arc from 2006 to 2026, seven major process licensors followed a unified commercial trajectory: monetizing high-efficiency process IP to build world-scale chemical complexes in China, North America, and the GCC while European manufacturing hollowed out—followed by a 2025–2026 inflection as foreign capacity reached saturation and US conglomerates consolidated European IP.
Seen through this twenty-year commercial arc, the November 2026 UK–EU ETS linking agreement and Europe’s Carbon Border Adjustment Mechanism (CBAM) look less like industrial offensives and more like defensive damage control after the competitive horse has bolted.
Unintended Consequences—and Why Linking Schemes Warrants Caution
By treating a complex industrial transition as a purely financial cap-and-trade exercise, the EU ETS has introduced severe unintended consequences that even the LSE authors acknowledge in their concluding warnings:
- Deindustrialisation disguised as decarbonisation: As free allowances phase out between 2026 and 2034, carbon costs become a direct tax on European production. While the EU’s Carbon Border Adjustment Mechanism (CBAM) attempts to level the playing field on imports, it offers zero protection for European exports. In sectors like steel—where exports represent a fifth of EU output—uncompensated carbon costs simply push production and emissions overseas (“export carbon leakage”) while hollowing out domestic industrial capacity, which has already been weakened by the choice of Western companies to cash in on supply chain dominance in petrochemicals outside of Europe.
- The looming political reckoning of ETS 2: Until now, the EU ETS avoided voter backlash because its costs were buried upstream in industrial supply chains. In 2027, the EU launches ETS 2, extending carbon pricing directly to road transport, home heating, and agriculture. History—from Australia to the United States—shows that when carbon markets hit household budgets directly without delivering tangible technological alternatives, political backlash swiftly follows.
The Bottom Line
Unlike the UNFCCC Clean Development Mechanism, which directly rewarded companies for engineering and deploying commercial abatement hardware, the EU ETS has evolved into a punitive fiscal instrument—one whose headline statistical triumphs rely heavily on energy-crisis demand destruction and heroic extrapolation.
As the UK and EU move forward with linking their carbon markets, policymakers and industry leaders alike should resist mistaking administrative market integration for an industrial decarbonisation strategy. Without an honest view of chemical industry strategies, lessons learned from the past, and a renewed focus on commercialising real abatement technology and protecting export competitiveness, linking two flawed caps will merely ensure that European industry shares the same structural headwinds.
Reference: Bogachev, A. and Venmans, F. (2026), “The effect of the EU Emission Trading Scheme on emissions”, Grantham Research Institute on Climate Change and the Environment, Working Paper No. 455, London School of Economics and Political Science